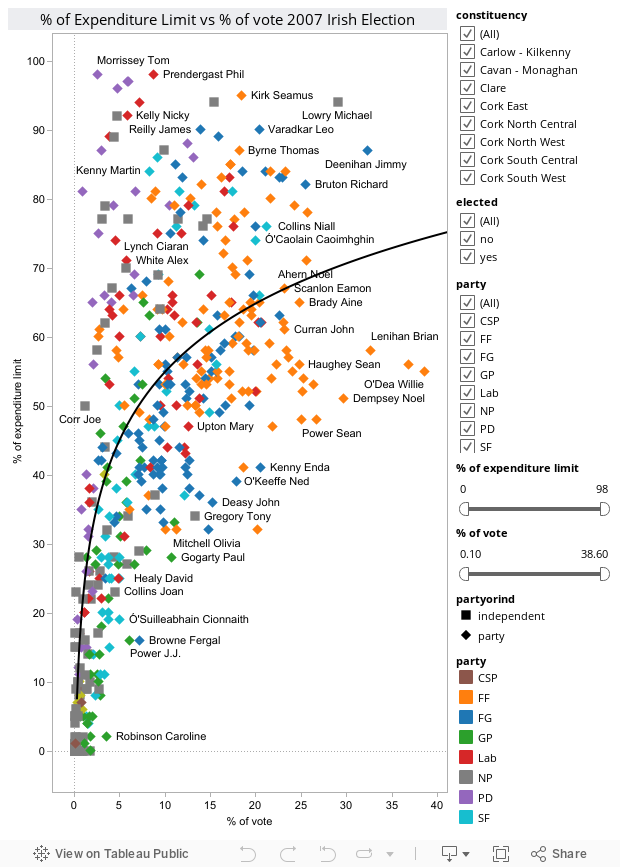
2007 election expenditure - SIPO
Displayed as percentage of spending limit and percentage of vote to normalise for the different sized constituencies.
* 3 seat constituency - €30,150.00
* 4 seat constituency - €37,650.00
* 5 seat constituency - €45,200.00
2007 Election guidelines from Standards in Public Office Commission.
2007 Election results on wikipedia
| Elected | Not Elected | All | All £ | Avg £ of Elected | Avg £ of Not Elected | Avg £ of All | |
| Votes Avg | 16.84% | 4.86% | 9.19% | ||||
| Spending Avg | 60.1% | 36.64% | 45.4% | 13,707 | 22,245 | 13,664 | 16,790 |
In the spreadsheet I have the data on the public and party funding, and the percentage that makes up of the candidates expenses just looking for a good way to show that.
Also need a better way to show the average e16,790 spend by candidates.
A 2011 candidates donations and costs

2 comments:
What is the degree of correlation (and significance) between them?
im not sure, the data is there, can you tell?
Post a Comment