Update 2015
Seanad Reform 2015
 This screen shot shows how I have used Simile Exhibit Widget to display Ireland's 60 Senators, members of Ireland's Seanad, (upper house) information exhibited, mapped, charted, listed and editable. Using information I gathered on this google spreadsheet and used google maps to display the 8 panels the senators seat on.
Seanad Eireann is the upper house of the Oireachtas (Irish parliament). It has 60 Senators, 43 are nominated on to 5 panels by professioanl bodies,having special knowledge of particular vocation, Administrative, Agricultural, Cultural and Educational, Industrial and Commercial, Labour and voted on by members of councils, the Dail and the previous Seanad elections, must be held within 90 days of the dissolution of the Dail. 11 are nominated by the Taoiseach, 6 are voted on by university graduates.
Its roles is to initiate, advise and revise legislation, senators also participate in Oireachtas committees. | Administrative Panel | 7 |
| Agricultural Panel | 11 |
| Cultural and Educational Panel | 5 |
| Industrial and Commercial Panel | 9 |
| Labour Panel | 11 |
| Taoiseach | 11 |
| University | 6 |
I hope the shape and the interactivity of the exhibit may help to explain the Seanad and its make up better to people.
I have made panels showing
PANELS • SENATORS • PERCENT VOTE • ELECTIONS • SENATORS DETAILS • NOMINATED BY • NOMINATING BODIES • POSITION • COMMITTEE • CONTACT • PANELS
which you can combine with the sliders
Terms - Age - Percent Vote - Gender
can you think of any more ways to display the data?
I have listed which professional organisation of member of the Dail or Seanad has nominated, which senator to which panel, and percentage vote they got from TDs, Senators and Councillors.
I have listed the nominating bodies, their websites, member numbers, their sub-associations and who they nominated to which panel.
Still to do
There are some mistakes on this, I have to review the Seanad byelections since 2007, can't find details of them and the oireachtas.ie won't respond and details of new senators, office locations, I added salary expenses, and should add donations, distance from Dail.
Questions
Is it just the boards of the nominating bodies who nominate?
Salary and Expenses Not sure best way to shows salary and expenses the figures I have from The Story FOI's, go year to year, including senators who were just elected, I tried to reflect that in my calculations
Corrections, for instance do you know where the town the senators operates from or his office?, go to maps.google.com centre over it then take the latitude and longitude from the link, double check by pasting those coordinates back into the google maps search and then change in the TD spreadsheet and leave a comment on the cell too.
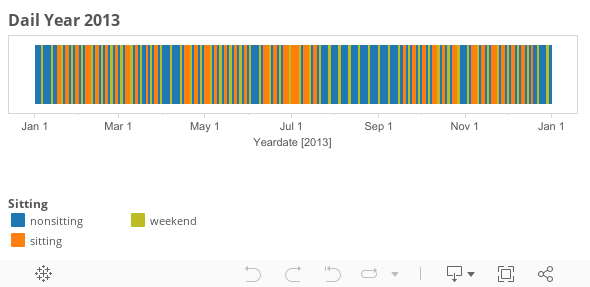
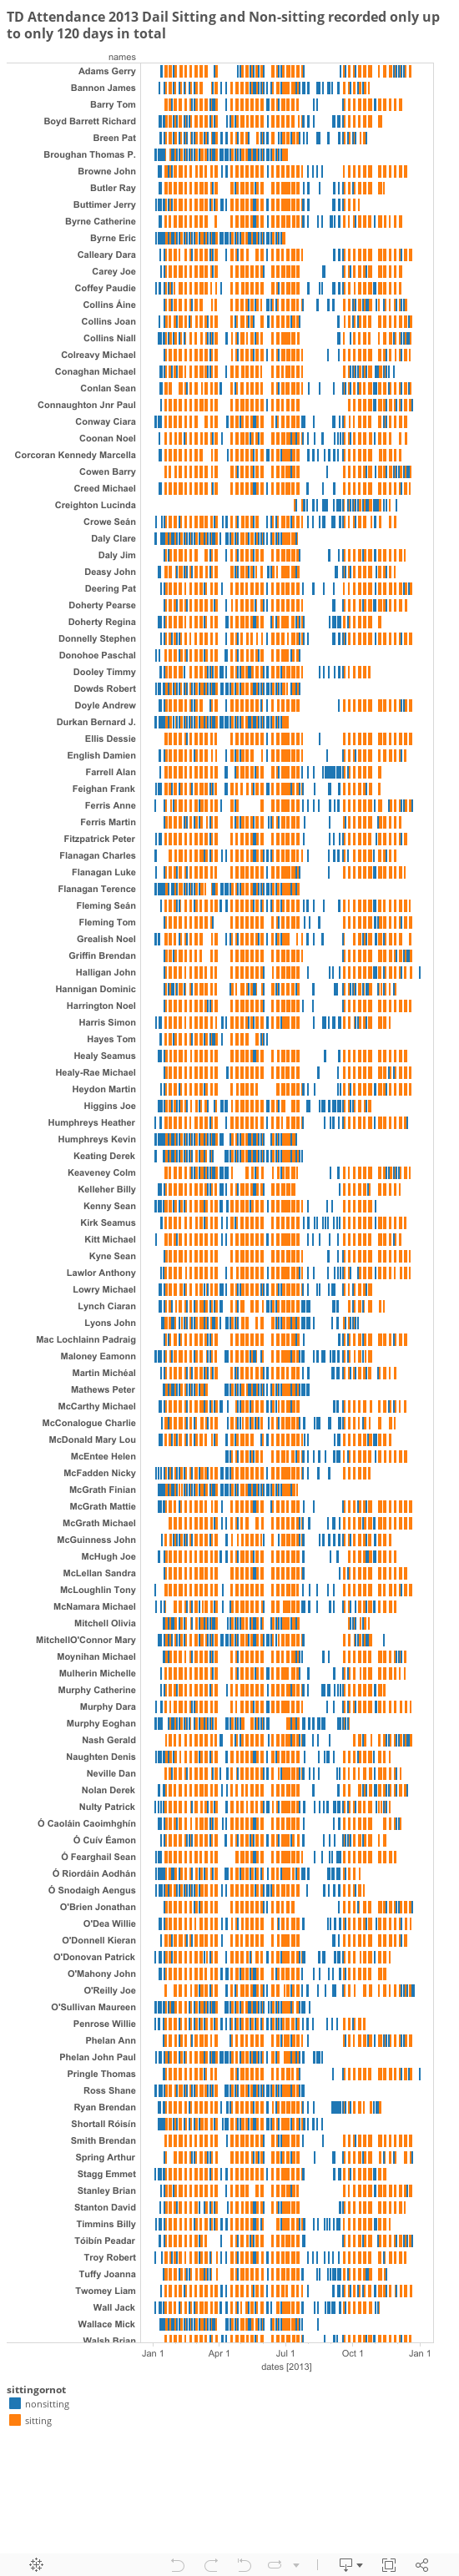
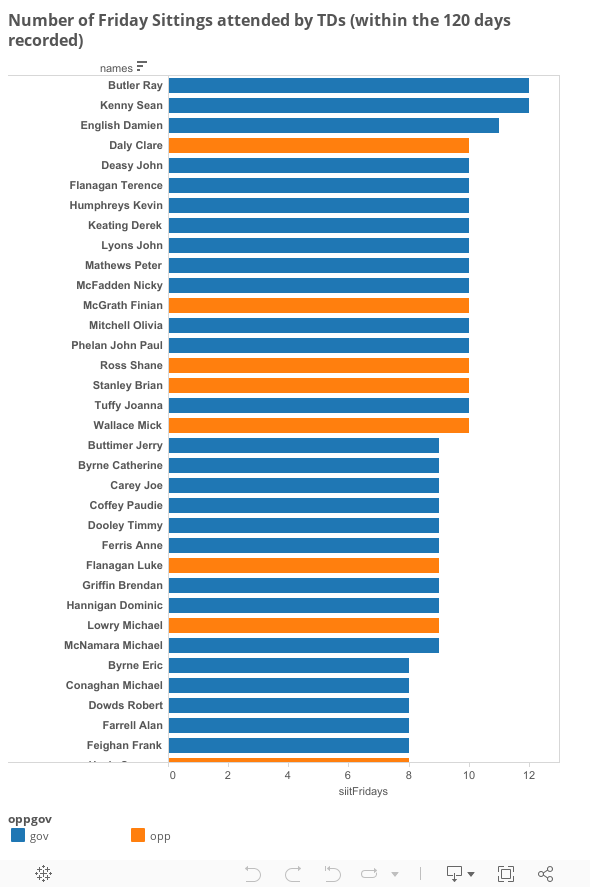
This is follow up to my previous Dail TD exhibit
MIT Exhibit
Made with Exhibit from MIT which...
Exhibit enables you to create html pages with dynamic exhibits of data collections without resorting to complex database and server-side technologies. The collections can be searched and browsed using faceted browsing. Assorted views are provided including Timelines, tiles, maps, charts and more.
I have been very impressed with MIT exhibit, there is a whole suite of systems for displaying large amounts of data simply and lightly. Though its a fair few years old and isn't being updated any more I wasn't sure whether it was worth pursuing and using to create my Irish Politics displays but I haven't seem anything as impressive and easy to adapt for a copy and paste coder like me. Looking around for visualisations, faceted search (which is usually associated with semantic web) and mapping systems. Some directions and files to help run it off your own server.
You can use exhibit with in a semantic mediawiki install, or simpler table wibbit version. You can embed exhibit and timelines in wordpress using Datapress or Drupal once you converted some data to static json file. .json file example with Babel.
The best part of Exhibit is using faceted sidebar menus to display lots of categories of data and combinations of data. And being able to call that from google spreadsheets which you can leave open for editing and correction.
You can pick out any element or facet of the info from the list on the left, click on map or sliders, deselect it by un-checking on the sidebar list or use your browser's back button. You click on any icon to get an info bubble on that TD. You can zoom into the map by clicking on the constituencies map on the right or turn off the constituency polygons below, you can click any of the panels at the top to show, charts and voting maps, look at list of information on the TDs or see all the data on them.
I modified the Presidents Births and Death example of which you can see it's simple JSON file. You can use MIT's Babel to convert your data to JSON or XML (create live XML with editgrid.com) or any exhibit friendly form.
I rearranged my information into this google doc file with {labels} so that the Exhibit script can read it as JSON. How to make an exhibit from data fed directly from a Google Spreadsheet You copy code from the examples and Exhibit wiki and add panels that are coded like this
ex:role="exhibit-view"   id="map1"  ex:collectionID="bothcollection2"
   ex:viewClass="Exhibit.MapView"
   ex:label="Irish TDs"
   ex:eventlabel=".td"
   ex:size="large"
   ex:zoom="7"
   ex:mapHeight="600"
   ex:center="53.45,-8.0"
   ex:overviewControl="true"
   ex:showSummary="true"
   ex:latlng=".latlng"
   ex:polygon=".constpoly"
   ex:pin="false"
   ex:borderOpacity="1.0"
   ex:borderWidth="1"
   ex:borderColor="purple"
   ex:opacity="0.0"
   ex:showToolbox="false"
   ex:icon=".imageURL"
...calling the named columns from the google spreadsheets.
Description of how I made the government travel exhibit.
Because senators don't have constituencies, I have arranged them into the 8 panels, Administrative, Agricultural, Cultural & Educational, Industrial & Commercial, Labour, National University of Ireland, Taoiseach and University of Dublin, arranged somewhat how they would be seated in the Seanad, usually voting with the government or the opposition.
Info
Oireachtas Senators
Seanad Eireann on Wikipedia
Committee
Members of the 23rd Seanad
List of senators at oir.ie
How Seanad is elected
Report on Seanad Reform
seandcount.ie internet archive
Seanad at Citizen Info
electionsireland.org Results
2007 Candidates
Register of Nominating Bodies 2009
Register of Nominating Bodies 2007
Seanad Electoral Roll pdf
List Nominating Bodies
 Information
Timelines
I've created a time line of when the currents Senators were first elected. The time line extension is part of its own Simile timeline system which can get more info on how to use on its wiki. Although its not easy to show the times Senators didn't get elected and then returned a following election. (to stop and start the timeline on the same line with the same person). So for the moment it does not show that and goes straight first election to most recent.
Collections and Types
I have multiple collections in this exhibit to call the types and collections 60 senators in one spreadsheet and nominating and associated info in another spreadsheet. Thankfully David Huynh provided the code to call from one the other or both collections in the mailing list. I'm not sure if can write code to add a third one (partys).
The Data
I have split the senator google spreadsheet into different sheets, bio,time,websites,locations,positions,panellatlng,elections,nombods,nom2007 that are read by the main senator sheet,you edit the the subpages and they will be renewed by the main page, do not re-sort them.
Information categories most of which you can select in any combination.
| facet | category | source |
| label | name | |
| type | type | |
| party | party | |
| panel | panel | |
| longaddress | long address | |
| address | address,town | |
| area | area | |
| county | county | |
| senator | senator | |
| lat | lat | |
| lng | lng | |
| latlng | town coordinates | |
| senconstituency | who votes for them,td councillors,senators | |
| description | description | |
| position | position | |
| spokespersonissues | spokesperson issues | |
| committee | committee | |
| tdcllr | tdcllr | |
| nicestartdate | nicestartdate | |
| start | start | |
| end | end | |
| dailterm | dailterm | |
| terms | terms | |
| oirterms | oirterms | |
| age | age | |
| position | position | |
| knowlpractexp | knowlegde practical experience | |
| nominatedby | nominated by | |
| subpanel | subpanel | |
| electorate | electorate | |
| firstpref | firstpref | |
| electorate | electorate | |
| seats | seats | |
| candidates | candidates | |
| quota | quota | |
| percentvote | percent vote | |
| govopp | govopp | |
| voteswith | voteswith | |
| phone | phone | |
| email | email | |
| govopp | govopp | |
| voteswith | votes with | |
| panellatlng | front map panel | |
| gender | gender | |
| imageURL | imageURL | |
| wikiurl | wikiurl | |
| website | website | |
| partywebsite | partywebsite | |
| ksurl | kildarestreet seanad speeches | |
| partycol | partycol | |
| nombod1 | nombod1 | |
| nomurl1 | nomurl1 | |
| nombod1 | nombod1 | |
| nomurl2 | nomurl2 | |
| nombod3 | nombod3 | |
| comment | comment | |

Nominating Bodies
| label | source |
| nominated | |
| type | |
| nominatingbody | |
| nomurl | |
| panel | < |
| subpanel | |
| nombodmembers | |
| nombodassoc | |
| nombodassocurl | |
| irishnames | |


